
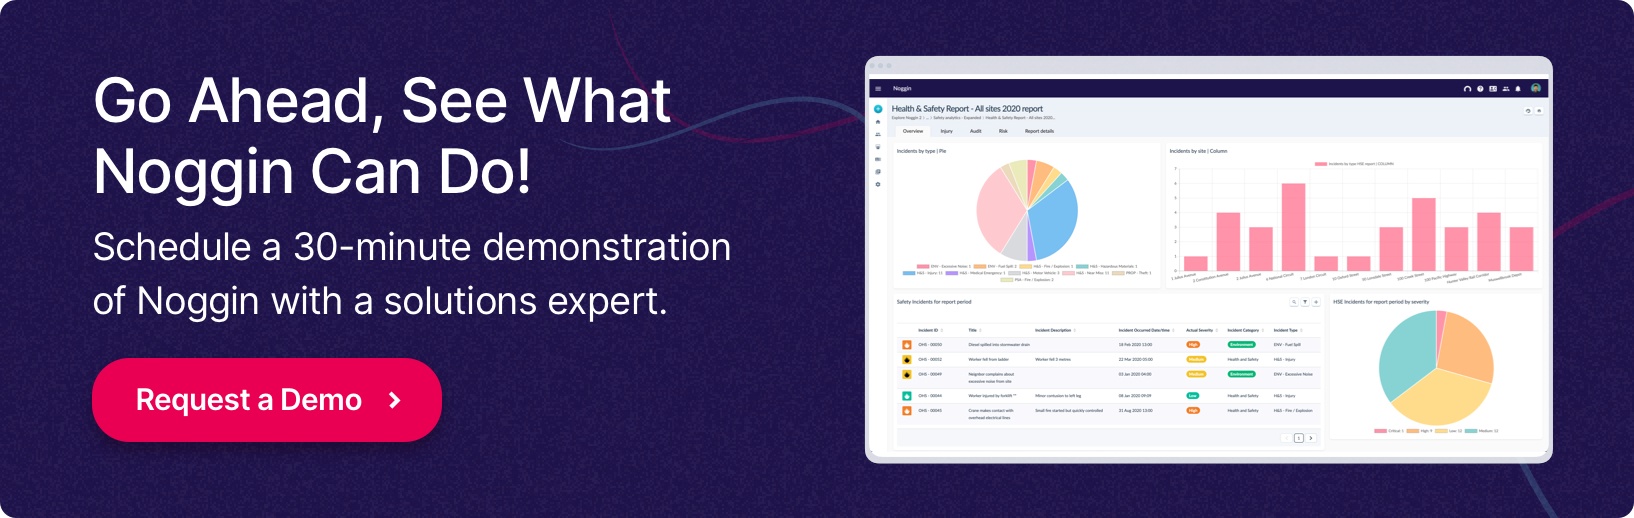
Request a Demo
Fill in the form below and we will contact you shortly to organised your personalised demonstration of the Noggin platform.

Meet Noggin
An integrated resilience workspace that seamlessly integrates 10 core solutions into one, easy-to-use software platform.


The Noggin Platform
The world's leading integrated resilience workspace for risk and business continuity management, operational resilience, incident & crisis management, and security & safety operations.

Industries
Explore Noggin's integrated resilience software, purpose-built for any industry.


A Resilience Management Software Buyer's Guide

Who We Are
The world’s leading platform for integrated safety & security management.

14min read
.svg)
.svg)
.svg)
Decision support to ensure business resilience
When it comes to organizational resilience, much is made of the importance of situational awareness.
Understandably so. Up-to-the-minute knowledge of objects, events, people, system states, interactions, environmental conditions, and other situation-specific factors is critical to mobilizing a rapid, efficient, and effective response to a critical event or disruptive incident.ii
Situational awareness, however, is not an aim in and of itself.
Whether it’s of a corporate or climate crisis, knowledge and understanding of the current situation, as describes the U.S. Army Field Manual, is meant to promote the timely, relevant, and accurate assessment of an operation, in other words to facilitate real-time decision making.
Situational awareness, as such, is the means. Decision support is the end.
And key to decision support is the collecting, analysis, and understanding of historical inefficiencies, through the creation of data models.iii
This is known as data-driven decision making.
In data-driven decision making, we use facts, metrics, and, of course, data to inform strategic (business) decisions that align with goals, objectives, and initiatives.
The point is to draw full value from relevant data sources to empower everyone to make better decisions with that data, every day.
Challenges to data-backed decision making
Easier said than done.
Any number of challenges stand in the way of data-backed decision making. One of the most acute, according to Deloitte, is legacy processes. Siloed data and lack of time among practitioners are also common barriers to data-backed decision making.
Another challenge is a lack of enterprise-wide training on data literacy and data-driven decision making.
Then, there’s the problem of the data itself.
Among relevant analysts, the consensus has emerged that the amount of information collected has never been greater.
What’s wrong with that?
Information, while abundant, has never been more complex and difficult to parse. And as a result, organizations are struggling to manage and analyze the troves of data on which they sit.
Just look at industry surveys. NewVantage Partners has reported that while 99 per cent of executives indicated an aspiration to drive a data-driven culture, less than a third report having success.
Investments in technology, specifically, are running up against this lack of a formalized data culture. The result: increases in data are often causing misalignment and decreases in the speed to decision.
Why does it matter? Well, integrating noisy data sources into real-time incident detection models is complex. Rendered even more complex because the learning procedures that go into these models must also be adaptive.
With those challenges affecting the delivery of effective decision support in resilience, organizations must ask themselves what can they do?
As this guide will argue, digital dashboard capabilities within resilience management software can help.
Challenges to effective decision support in emergency & incident management
Within integrated resilience management, challenges to effective decision support in emergency and incident management deserve special comment.
The aim of decision support, here, is to enable agencies to detect and report incidents automatically, as well as dynamically adapt resource allocation and dispatch approaches, even if the environment in which the emergencies occur changes.
To do so, agencies must develop incident forecasting models that (1) can generalize across large geographic areas, (2) have high spatial-temporal resolution, and (3) handle high data sparsity.i
It’s not that easy.
Disasters and security attacks, for instance, are likely to hinder operations by knocking out communications. In such incidents, agencies will require forecasts over fine spatial and temporal resolutions, argue experts; yet, learning incident prediction models at high resolutions in this context is extremely difficult due to data sparsity.i
And as mentioned above, achieving situational awareness itself requires information from lots of different data sources – sources which are often noisy.
| Challenge | Description |
| Coordination |
Emergency response management (ERM) requires coordination between multiple agencies and decision makers, each with their own objectives. Each decision maker often has access to only incomplete information, and coordination must happen quickly while a situation is unfolding. |
|
Data collection |
It’s difficult to collect, integrate, and pre-process the eclectic data that forms the foundation for emergency response systems. Much of the data has high volume and velocity and is from diverse sources. This large set of data must then be narrowed down to a set of useful features. |
|
Incident forecasting |
Incident occurrence is difficult to model due to incidents’ inherent randomness and high sparsity. We have also shown that incident models are sensitive to spatial-temporal resolution, which makes high-fidelity models challenging to learn. |
|
Incident detection |
Fast incident detection is critical for timely response, but traditional reporting methods have time delays. Crowdsourced data-streams (e.g., Waze) provide an opportunity for early identification, but are noisy and uncertain. |
|
Dynamic environments |
The environments in which ERM systems operate change over both long- and short-time scales. ERM systems must adapt to this non-stationarity. |
|
Communications |
Many emergency incidents cause failures in communication networks. ERM systems must be robust to communication loss to maintain service in such situations. |
Source: Designing Decision Support Systems for Emergency Response: Challenges and Opportunities
The rise of digital dashboards
Indeed, dashboard systems themselves aren’t new.iv The forerunners of technologies that now provide real-time, relevant information on the current state of the organization to executive-level decision makers first emerged in the 1970s, taking off in the 1980s, thanks to advances in computer displays and graphical user interfaces.
Subsequent innovation in the 1990s and early 2000s served to lower development costs, widening accessibility of digital dashboards to lower-level managers.v This wider accessibility proved key to the take-off of digital dashboards in the business world.
These dashboards, as we know them today, are meant to provide “key, relevant information,” allowing for the summary of volumes of data in meaningful measures.vi They do so by means of intuitive visualizations, which militate against information overload.
Unfortunately, the acceptance of digital dashboards in resilience management has been slower than in the wider business world.
Done right, however, digital dashboards can provide the same basic functionality in resilience management, namely operational and executive dashboards – retaining the single display format to visualize data and KPIs with charts and gauges and enable monitoring of assets and resources in real-time – which then allow managers and decision makers to better comprehend data from complex, data feeds.
What’s more, the visualized presentation of information in matters of business resilience, just like in the wider business world, enables managers and decision makers to grasp insights out of noisy data sources, helping them to (1) make more informed decisions, (2) take precise actions, and (3) create more comprehensive strategies during a crisis.
In sum, the benefits of digital dashboards in resilience management include the abilities to:
- Assess important metrics and key performance indicators for better decision-making and situational understanding, while reducing data analysis and reporting time
- Simplify and expose information, making it easy to draw conclusions and make decisions
- Adapt quickly to changes, incidents, risks, regulations, and more
- Implement smarter decision-making processes and improve decision-making
- Track progress and success against organizational goals, compliance requirements, and other outcomes
What must digital dashboard do in integrated resilience management?
The question then turns to what is needed from digital dashboards to ensure decision support for resilience management?
Let’s look at the varying use cases.
After all, managers and decision makers will rely on operational and executive dashboards to support a different type of mission than their for-profit business counterparts. And so, across the various resilience-related solution areas, the various tasks that digital dashboards must be able to perform include the following:
Safety Executive dashboard
Access executive reports and monitor current incidents, observations, engagements, and actions, with metrics across severity, type, and the number of days open. View a trend of the number of events that occur each day and what time of day they occur, as well as all events to date. Then dive deeper with a breakdown of trends per type. Expand situational awareness with live web feeds, such as work safety announcements and weather maps.
Security Manager statistics and reporting dashboard
Generate security reports and assess security trends, track the number of incidents and patrols by type, compare the number of patrols and incidents per month, and view the number of incidents per organizational unit over time. Quickly access current security breaches, investigations, incidents, and more. Gain key insights to the number of visitors and tours, lost and found property, and shifts and patrols at sites each month.
Emergency Operations Centers (EOCs) dashboard
Get an overall picture of operations for EOCs, including their activation levels and possible impact of this to other EOCs in the surrounding area. Quickly access active incidents and assess the possible impact of multiple incidents based on their location and monitor exercises to see how ready the organization is to respond to critical events. Gain insights to the number of incidents the organization responds to each month and assess these by type and responsible EOC.
Business Continuity Executive dashboard
Gain insights to how the organization is preparing for and responding to disruption and the associated impacts. Analyze prioritized activities, business impact analyses, reports, and recovery strategies for business units. Understand the organization’s current situation with quick access to incidents where prioritized activities are affected, and see how ready the organization is to respond to critical events by analyzing the outcomes of exercises.
Crisis Executive statistics dashboard
Assess the number of incidents that occurred per month and per month by type, gain situational awareness, and quickly access current incidents and exercises.
Digital dashboard capabilities to consider
Given the use cases above, the final product must consist of analytical tools that combine and visualize data to uncover insights about the organization and inform the important decisions that need to be made every day.
To that end, digital dashboards must provide real-time results by aggregating and extracting value from the information put in an integrated resilience management workspace, making it quick and easy to assess the various aspects of the organization, team, compliance, or current situation, and identify if something is wrong.
These generic capabilities will also allow decision makers to adopt more sustainable decision-making processes and avoid the consequences of short-term focus, particularly in high-risk environments.
What other digital dashboard capabilities should organizations consider?
Library of dashboards
Consider platforms that come equipped with an extensive library of dashboards tailored to providing different types of information, e.g.,
- Operational and situational dashboards to help you know where you stand at any given time.
- Analytical dashboards to identify trends and make better decisions.
- Strategic dashboards for executive decision makers to track the performance of your organization in managing incidents, risks, compliance, and more.
Interactive
Digital dashboards should also be interactive including features such as filters, charts, tables, situational maps, and web feeds. That helps to ensure you can:
- Export or print information
- Navigate to explore the data, and/or
- Edit data directly from a dashboard
Flexibility
Digital dashboards should also be versatile, enabling you to view the data that best suits your needs, monitor situations, and key metrics, and easily understand and explain the data represented.
Conclusion
Finally, when it comes to the ability of your business to absorb change and adapt to a new environment, data is king. But not all data configurations lend themselves to ensuring up-to-date understanding of the organization’s context and coordination across various solution areas for effective risk and incident management.
Which ones do? Digital dashboards, such as those in Noggin’s integrated resilience management workplace, stand out as analytical tools that combine and visualize data to uncover insights about your organization and inform the important decisions you need to make every day.
Beyond visualizations that simplify information into highly digestible forms, these dashboards let you implement smarter decision-making process to improve decision-making and better adapt to changes, incidents, risks, regulations, and more.
Sources
i Staff, Fire Engineering: Situational Awareness: Key to Emergency Response. Available at https://www.fireengineering.com/firefighting/situational-awareness-key-to-emergency-response/#gref.
ii Tara Kedia et al, Disaster Medicine and Public Health Preparedness: Technologies Enabling Situational Awareness During Disaster Response: A Systematic Review. Available at https://www.cambridge.org/core/journals/disaster-medicine-and-public-health-preparedness/article/technologies-enabling-situational-awareness-during-disaster-response-a-systematic-review/4B303623ECEF3F0413C68F1462DFC00F.
iii Geoffrey Pettet et al, Vanderbilt and George Mason Universities: Designing Decision Support Systems for Emergency Response: Challenges and Opportunities. Available at https://arxiv.org/pdf/2202.11268.pdf.
iv A Kirtland: Executive Dashboards. Boxes and Arrows. Available at http://www.boxesandarrows.com/archives/ executive_dashboards.php.
v Ibid.
vi Geoffrey Pettet et al, Vanderbilt and George Mason Universities: Designing Decision Support Systems for Emergency Response: Challenges and Opportunities. Available at https://arxiv.org/pdf/2202.11268.pdf.
.svg)
Download your copy
About this Article
Published May 23, 2024